New Satellite Data Reveals Global Emissions Inventory from Open Biomass Burning
Recent research utilizing data from the Chinese Fengyun-3D satellite has unveiled a comprehensive global inventory of emissions from open biomass burning (OBB). This study, published in the Earth System Science Data on August 2,was conducted by a team of scientists led by SHI Yusheng, a researcher with the Aerospace Information Research Institute (AIR) under the Chinese Academy of Sciences (CAS), providing crucial insights into the impact of OBB on air quality, climate, and human health.
OBB refers to the act of burning plant material, like trees, grass, and crops, in open spaces such as forests, fields, and grasslands. The study focuses on the significant role that OBB plays in releasing various pollutants, including carbon dioxide (CO₂), carbon monoxide (CO), methane (CH₄), and particulate matter (PM2.5 and PM10). By leveraging high-resolution daily fire spot monitoring data from the Fengyun-3D satellite, the researchers developed a global OBB emission inventory with a resolution of 1 × 1 km for the years 2020 to 2022.
The study found that, on average, open biomass burning (OBB) produces a large amount of pollution each year. Specifically, it releases 2,586.88 teragrams (Tg) of carbon (C), 8,841.45 Tg of carbon dioxide (CO₂), 382.96 Tg of carbon monoxide (CO), and 15.83 Tg of methane (CH₄), along with several other pollutants. These numbers show how much OBB contributes to global pollution.
Southern Hemisphere Africa was identified as the largest source of carbon from OBB, contributing 847.04 Tg of carbon each year. Other major contributors included Southern Hemisphere South America with 525.56 Tg of carbon per year and Northern Hemisphere Africa with 394.26 Tg of carbon per year.
Savanna grasslands were found to be the predominant source of carbon emissions, accounting for 46.74% of the total annual emissions. This was followed by woody savannas/shrubs and tropical forests, which contributed 33.04% and 12.11%, respectively.
The study observed notable seasonal variations in carbon emissions, with peaks in September 2020, and August of 2021 and 2022. The average emissions during these peak months were significantly higher than the monthly average.
The research employed the data from Chinese Fengyun satellite, which can detect small fires, coupled with biomass data and combustion efficiency indices derived from vegetation indices. This approach allowed for a more accurate estimation of OBB emissions compared to previous methods that relied heavily on MODIS active fire products.
The findings from this study are crucial for improving air quality models and understanding the biogeochemical cycles affected by OBB. The detailed emissions data is expected to aid policymakers in devising strategies to mitigate the adverse effects of biomass burning on the environment and public health.
The Global Emissions Inventory from Open Biomass Burning (GEIOBB) dataset is publicly available for further research and analysis. It can be accessed through the following DOI: https://doi.org/10.6084/m9.figshare.24793623.
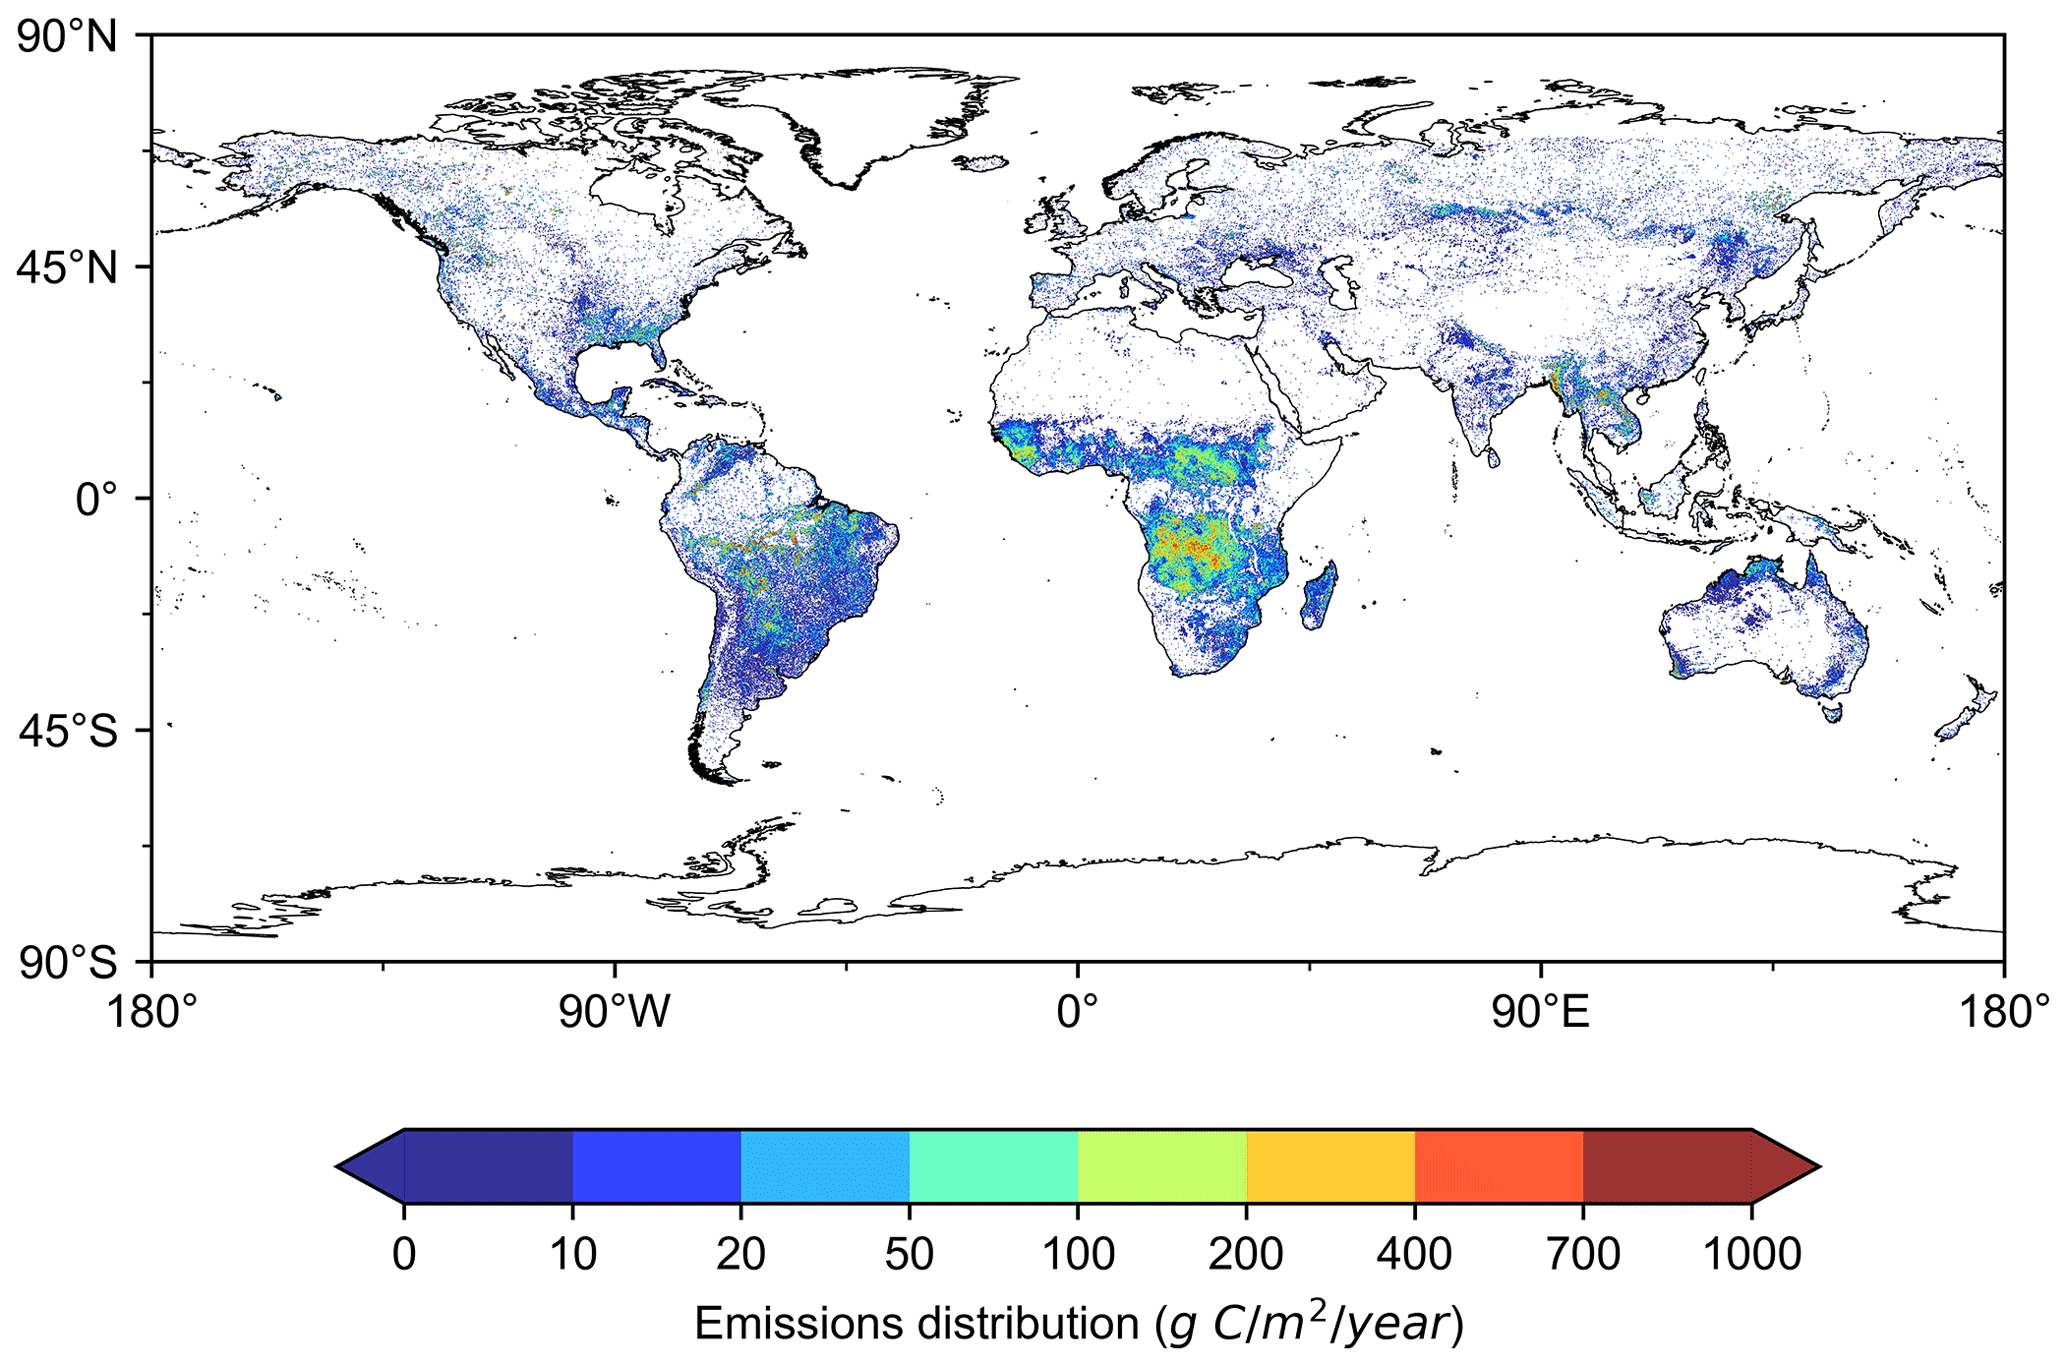
Spatial distribution of annual average OBB carbon emissions (1 km×1 km) during 2020–2022. (Image by AIR)
Contact: luyq@aircas.ac.cn
News & Events